MTTR is a Misleading Metric—Now What?
Editor’s note: This is the second part of a series that will focus on each one of The VOID Report 2021 key findings. If you did not have a chance to read the report, you can read the overview and key findings in the Announcing the VOID blog post. Or email us at void@verica.io to get the full report.
Software organizations tend to value measurement, iteration, and improvement based on data. These are great things for an organization to focus on; however, this has led to an industry practice of calculating and tracking Mean Time to Resolve, or MTTR. While it’s understandable to want to have a clear metric for tracking incident resolution, MTTR is problematic for a couple of reasons.
The first is solely statistical: based on the data we see in the VOID , measures of central tendency like the mean, aren’t a good representation of positively-skewed data, in which most values are clustered around the left side of the distribution while the right tail of the distribution is longer and contains fewer values. The mean will be influenced by the spread of the data, and the inherent outliers. Consider these Google data:
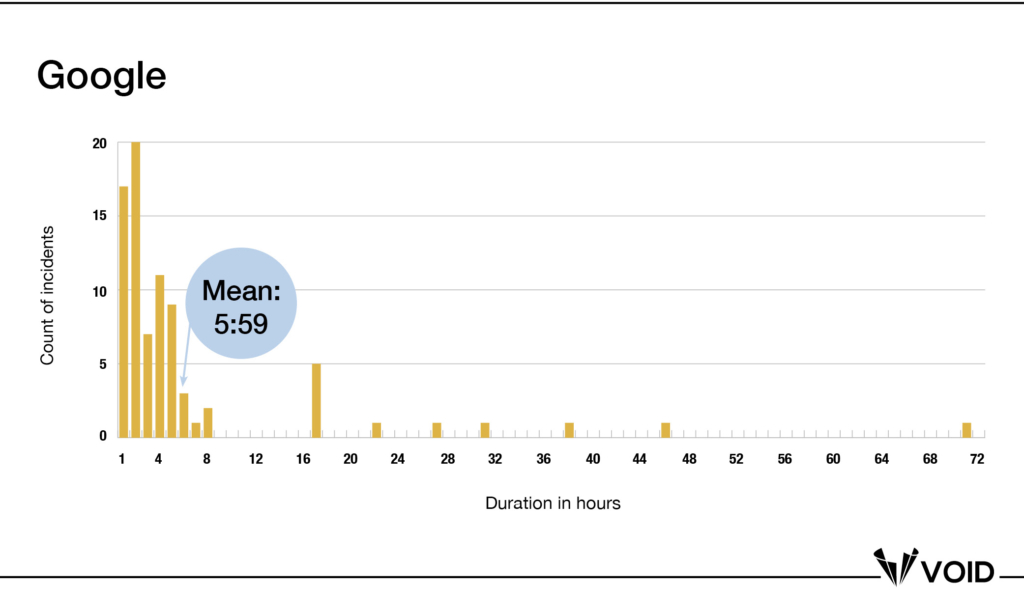
The mean is clearly well to the right of the majority of the data points in the distribution—this is to be expected for a positively-skewed distribution with a small set of large outliers. So next you might consider a different MTTR: Median Time to Respond. The median value will be less influenced by outliers, so it might be a better representation of the data that you could use over time.
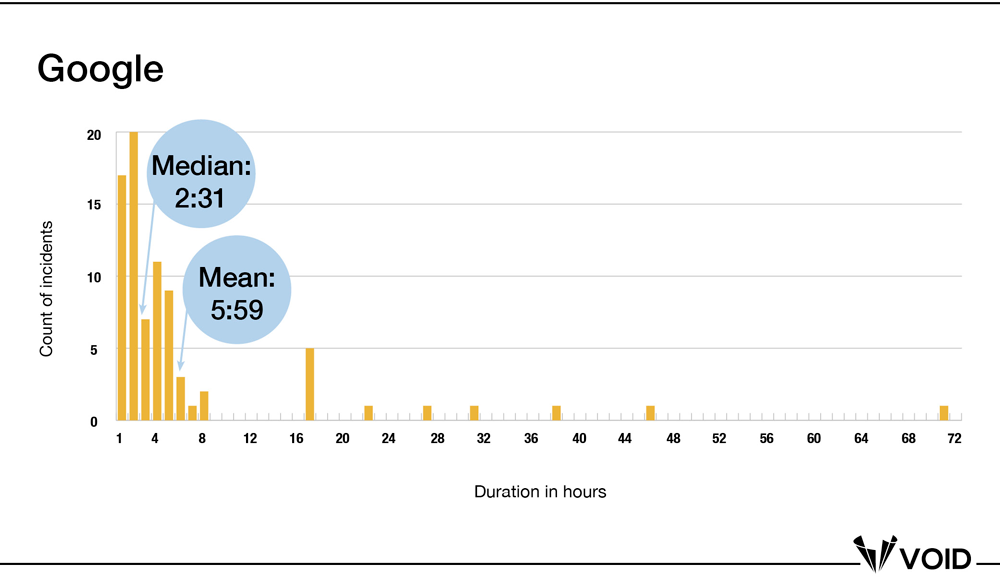
That certainly looks more representative, and your putative incident response metric just got 2.5 hours better simply by looking at it this way. Which begs the question: what actionable conclusions can you reach based on this information? Presumably, you calculate and track a metric like this in order to improve (or know when things are getting worse), which means you need to be able to detect changes in that metric. This is where Stepan Davidovič was able to demonstrate something really powerful in his report on MTTR, which is also applicable to these data.
Davidovič demonstrated both with empirical data and Monte Carlo simulations how incident duration data do not lend themselves to reliable calculations of improvement related to any central tendency calculations of incident duration (or overall incident count). If you’re not familiar with Monte Carlo simulations, think of it as an A/B test on simulated data instead of real-world production data. Davidovič took two different, equally-sized samples from three companies’ incident data, and compared the two sets, one which had experimental changes applied to it (e.g. a 10% improvement in incident duration), and the other which had no changes and acted as the control. He then calculated the MTTR difference between the two samples over a series of 100K simulations, such that a positive value indicates an improvement, or shortening of MTTR.
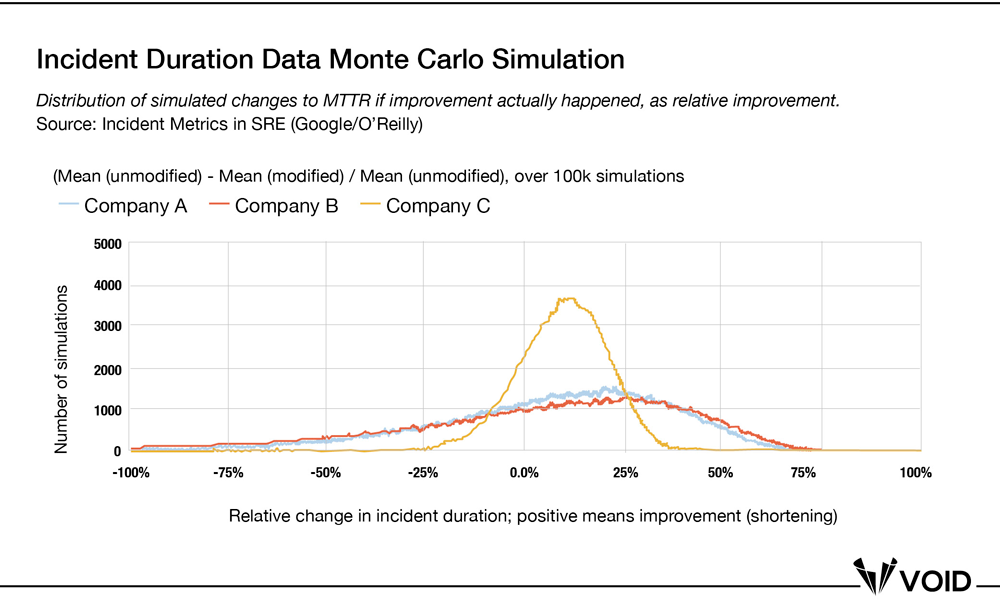
From Davidovič’s summary: “38% of the simulations had the MTTR difference fall below zero for Company A, 40% for Company B, and 20% for Company C. Looking at the absolute change in MTTR, the probability of seeing at least a 15-minute improvement is only 49%, 50%, and 64%, respectively. Even though the experimental condition shortened incidents, the odds of detecting any improvement at all are well outside the tolerance of 10% random flukes.”
Even more surprisingly, Davidovič ran the same simulation with no changes to either sample group. The results were similar to when an improvement was intentionally added to one of the sample groups. Even when nothing changed, between 10-23% of the time (depending on which company it was), the simulation returned improvements in MTTR between the sample sets. Davidovič concluded, “We’ve learned that even without any intentional change to the incident durations, many [simulations] would make you believe that the MTTR got much shorter—or much longer—without any structural change. If you can’t tell when things aren’t changing, you’ll have a hard time telling when they do.” He also went further to demonstrate that other measures—often called MTTx, including the median, geometric mean, absolute duration sum, —all fell prey to similar problems with the high variance of the data (this applied for incident total counts as well). Given that our incident report data follow the same distribution, we can presume these effects (or lack thereof, depending on how you look at it) are also present in our data.
If the metric you’re using isn’t itself reliable, then how could it possibly be valuable as a broader measure of system reliability?
MTTx Are Shallow Data
The second problem with MTTx metrics is they are trying to simplify something that is inherently complex. They tell us little about what an incident is really like for the organization, which can vary wildly in terms of the number of people and teams involved, the level of stress, what is needed technically and organizationally to fix it, and what the team learned as a result. MTTx (along with other data like severity, impact, count, and so on) are what John Allspaw calls “shallow” incident data. They are appealing because they appear to make clear, concrete sense of what are really messy, surprising situations that don’t lend themselves to simple summaries. As Allspaw notes, “Two incidents of the same length can have dramatically different levels of surprise and uncertainty in how people came to understand what was happening. They can also contain wildly different risks with respect to taking actions that are meant to mitigate or improve the situation.” Conversely, the exact same set of technological circumstances could conceivably go a lot of different ways depending on the responders, what they know or don’t know, their risk appetite, internal pressures, etc.
The length of an incident yields little internally actionable information about the incident. Consider two chess games of the same length but very different pace, expertise, and complexity of moves; feature films that generally all clock in at around two hours but can have wildly different plots, complexity of characters, production budgets; War and Peace (~1,200 pages) vs Slaughterhouse Five (~200 pages).
Could we add more to the current view of our data to get a little deeper and learn more? Let’s take a closer look at duration over time data for Honeycomb, using their reported impact categories from their status page updates (None, Minor, Major, and Critical) to add more context to a few key incidents.
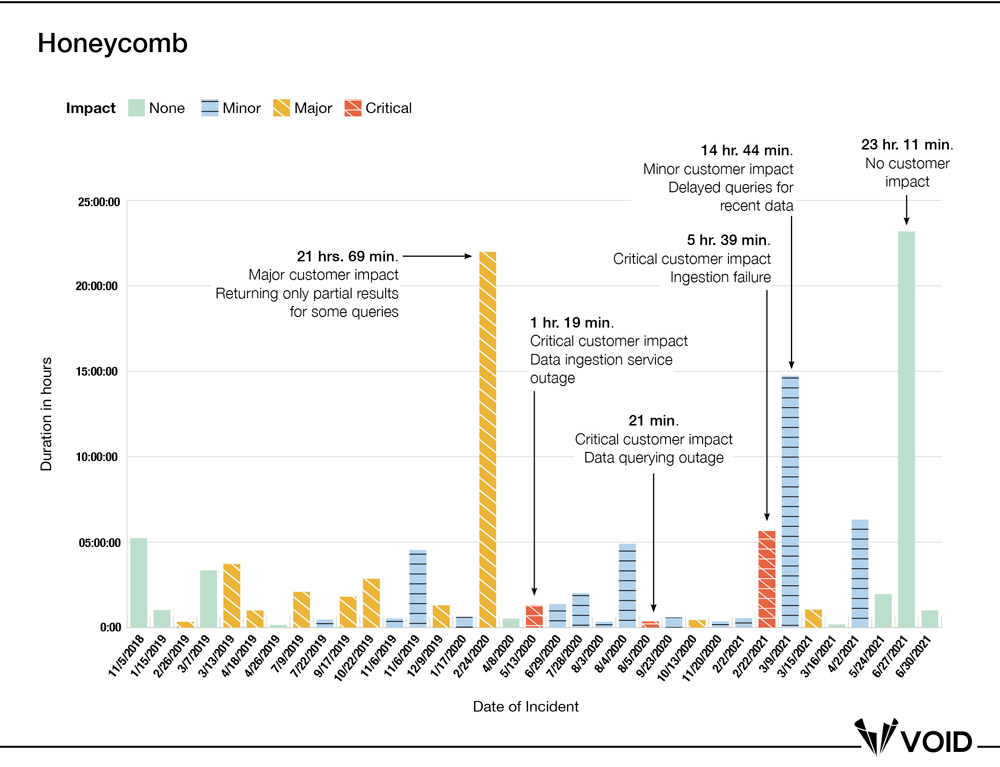
This additional information provides a little more context, but it only casts more doubt on duration (or MTTR) as a useful metric. First, we see that duration alone tells us little about external customer or internal team impact: for three of the five longest incidents, the customer impact was either minor or ultimately nonexistent. And two of the three incidents with critical impact were resolved in 21 minutes and 79 minutes, respectively. Could this be because the critical incidents were all hands on deck, while the others allowed the organization time to investigate and resolve the issue with less urgency? Does that mean that the response was “better” in one case than the other? Additionally, is a “major” incident similar across companies? We can’t know these things either. This is the inherently limited nature of shallow data. We can’t draw a sharp line around the nature of the impact of the incident, nor can we draw a sharp line around duration.
In the case of Honeycomb, however, we are fortunate to have additional, deeper information. They chose to write a detailed meta-summary of a number of incidents from early 2021. The summary makes almost no mention of incident durations, beyond noting an especially painful 14-hour incident in mid-March. It also diverges from most public write-ups that we see in that it includes coverage of:
- Internal, business and system pressures (that led to a large-scale architectural migration)
- Detailed technical and organizational background information about decisions, surprises, and optimizations/trade-offs made by the team
- What was confusing, difficult, or surprising about the incidents they encountered, and the shifting performance envelopes that ensued
An increase or decrease in MTTR would not help the team determine the above insights about their systems—those came from a decision to invest the time and resources into investigating the messy details of the incidents, including the non-technical forces at play.
Moving Beyond MTTx
We argue that organizations should stop using MTTX, or TTx data in general, as a metric related to organizational performance or reliability. First and foremost, if you are collecting this metric, chart the distribution of your incident data. If they’re positively skewed, then you’re not measuring what you think you’re measuring with MTTx, and you can’t rely on it.
Second, ask yourself what decisions you’re making based on those data. Are you prioritizing hiring SREs, or are you trying to justify budget or infrastructure investments? What could you decide given either a decrease or increase in TTx (were that a reliable metric)?
Given that MTTx metrics are not a meaningful indicator of an organization’s reliability or performance, the obvious question is what should organizations use instead? We’d like to challenge the premise of this question. While rolled-up quantitative metrics are often presented on organizational dashboards, quarterly reviews, and board presentations, they generally fail to capture the underlying complexity of software-related incidents. That said, it may not be possible to immediately or completely abandon metrics that management or execs want to see. Vanessa Huerta Granda, a Solutions Engineer at Jeli, has an excellent post detailing a process of using MTTR and incident count metrics as a way to “set the direction of the analysis we do around our entire incident universe.” They can be an excellent jumping-off point to then present the insights, themes, and desired outcomes of detailed qualitative incident analyses that highlight knowledge gaps, production pressures and trade-offs, and organizational/socio-technical misalignments, which are also an important form of data:
“Because we had that [qualitative] data we were able to make strategic recommendations that led to improvements in how we do our work. In addition, having that data allowed us to get buy-in from leadership to make a number of changes; both in our technology as well as in our culture. We beefed up a number of tools and processes, our product teams started attending retrospectives and prioritizing action items, most importantly everyone across the org had a better understanding of what all went behind ‘keeping the lights on.’”
If quantitative metrics are inescapable, we suggest focusing on Service Level Objectives (SLOs) and cost of coordination data. A detailed explanation of SLOs is beyond the scope of this report, but Chapter 17 of Implementing Service Level Objectives covers using SLOs as a substitute for MTTx and other common problematic reliability metrics. If people or staffing is something you need metrics for, consider tracking how many people were involved in each incident, across how many teams, and at what levels of the organization—these factors are what Dr. Laura Maguire deemed “hidden costs of coordination” that can add to the cognitive demands of people responding to incidents. There’s a big difference between a 30-minute incident that involves 10 people from three engineering teams, executives, and PR versus one that an engineer or two puzzles over for a day or so, and is lower impact. (Such metrics also help inform the degree of internal intensity of a given incident, which can be useful when trying to manage and prevent burnout from incident response activities.)
Lastly, Granda notes that your metrics and data will evolve as your incident analysis progresses and matures—the more you tackle the basic issues, the more complex the next set will be, and your metrics and data will need to adjust accordingly.
If you’ve found this interesting or helpful, help us fill the VOID! Submit your incidents at thevoid.community/submit-incident-report. Read more about the VOID and our key findings in the latest VOID Report.

Courtney Nash
Courtney Nash is a researcher focused on system safety and failures in complex sociotechnical systems. An erstwhile cognitive neuroscientist, she has always been fascinated by how people learn, and the ways memory influences how they solve problems. Over the past two decades, she’s held a variety of editorial, program management, research, and management roles at Holloway, Fastly, O’Reilly Media, Microsoft, and Amazon. She lives in the mountains where she skis, rides bikes, and herds dogs and kids.

Get Ahead of the Incident Curve
Discover key findings which confirm that accepted metrics for incidents
aren’t reliable and aren’t resulting in correct information.